Let me begin with a story. Back in early March, 2022, it was reported that Aaron Rodgers had agreed to a 4 year $200 million extension with the Packers that was meant to make him a Packer for life. One week later, it was reported the deal was actually worth $150 million over 3 years. Then finally, roughly one year and $42 million later, Aaron Rodgers was a Jet. The contract he agreed to with the Packers was rewritten to facilitate the trade to the Jets and served as nothing more than a placeholder. The reason for this story? It serves as a simple reminder that the reported details and the actual details of a contract may vary. Furthermore, it serves as a reminder that the actual details are set in mud, not stone.
With that said, it’s time to have the talk. The way we evaluate NFL contracts is wrong. We’re looking at the wrong things. In fact, I’d like to make a few public service announcements.
- Cash Flow is king.
- New money average is not the same as the total money average.
- Fully guaranteed is not the same as guaranteed.
- Dummy years are not real years.
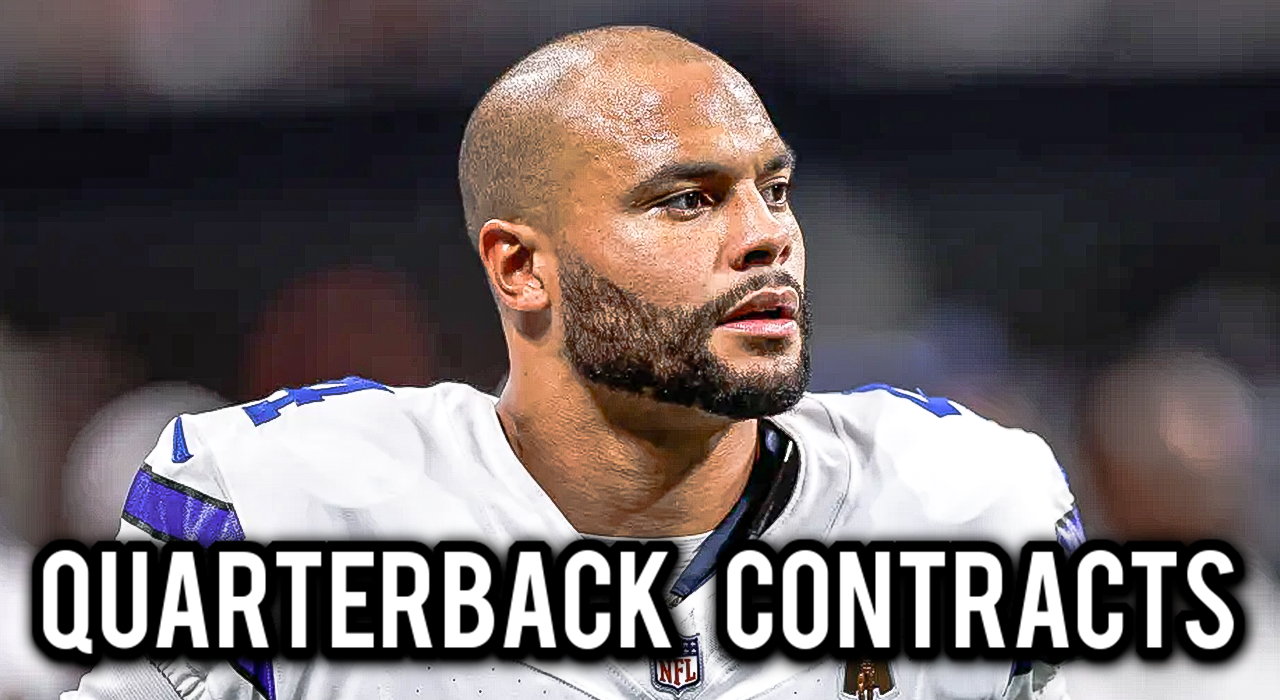
Okay, got that out of the way. In this piece, I’m going to break down quarterback contracts by a few noteworthy metrics. These metrics will be actual average annual value, 3-year average cash flow, and fully guaranteed money. I chose these metrics because they better represent the reality of how much a player is being paid. I will also be evaluating contracts from the most negotiation of cash flow timing. For example, Patrick Mahomes agreed to a restructure in 2023 that affected cash flow timing. As far as my method is concerned, Mahomes signed a new deal in 2023. One quick note before we get into this. The full details for the contracts agreed to by Matthew Stafford and Geno Smith this offseason have not been released. Therefore, I used the figures from their previous deals for calculation purposes. In the event either deal cracks the Top 10 for any of the utilized metrics, I will update the rankings.
Actual Average Annual Value
What’s the difference between average annual value and actual average annual value? It’s simple. Actual average annual value comes from evaluating a contract from the day it was signed until the day it expires. A quick example. Let’s say a player is under contract for 1 year at $5 million, then that player signs an extension worth $220 million over 4 years. The media is going to report that the player now makes an average annual value of $55 million per year. However, the actual terms of the contract state the player is due $225 million over 5 years. That would mean the actual average value is $45 million per year. I’ve never understood why we don’t evaluate contracts by their actual average annual value, but maybe I can start a movement. Now that we’re on the same page, here’s the Top 10 highest paid quarterbacks by actual average annual value over the length of their contract.
3-Year Average Annual Cash Flow
Cash Flow is King. There are a couple reasons for this. From a pure financial perspective, the value of a dollar today is greater than a dollar tomorrow. Another reason is that the longer a contract is, the less likely it is that a player will reach the end of that contract, especially without a renegotiation. Getting as much cash flow in the early years as possible sets the player up to collect more than they would with a back loaded contract. From an evaluation perspective, looking at the 3 year average cash flow will diminish the effect of any fake or dummy years. A common trick in the contract game is that players/agents will agree to contracts that include obscenely large base salaries in the later years of the contract to boost the average annual value for reporting purposes. Given the nature of quarterback contracts, the 3 year average cash flow should be safe from funny number math. So with that, here are the Top 10 highest paid quarterbacks by initial 3 year average annual cash flow.
Fully Guaranteed Money
There’s an old saying that “NFL” stands for “Not For Long.” When a player agrees to a contract, we often see an inflated guarantees number that includes injury guarantees and rolling guarantees that are not actually guaranteed. That’s not what this figure is. This figure is the amount of money that is fully guaranteed at signing. That means the player could fall off completely and still collect this money. Looking at you Deshaun Watson… Well, without further ado, here are the Top 10 highest paid quarterbacks in terms of money fully guaranteed at signing.
Observations
After breaking down quarterback contracts by these metrics, there are three quick observations I would like to note. First note, Josh Allen taking a “discount” is pretty overblown. The contract he agreed to gives him the 2nd highest actual average annual cash flow, 2nd highest 3 year annual cash flow, and 2nd highest figure fully guaranteed at signing. Could he have gotten more? Probably, but don’t be fooled. He is still very well compensated. Second note, Jared Goff and Tua Tagovailoa are getting paid very well. Despite signing deals with new money averages outside of the Top 5, Goff and Tua both find themselves in the Top 5 in actual average annual value. Third note, Patrick Mahomes is not as underpaid as the narrative leads us to believe. He finds himself 6th in actual average annual value and 5th in 3-year annual cash flow. Cash flows don’t lie. He’s probably still underpaid a bit, but at least he’s getting paid in the Top 5-6. In conclusion, I hope this breakdown helps readers better understand the reality of quarterback contracts.
Oh, and one last note, the Deshaun Watson contract is the worst contract in history. Great work Jimmy Haslam! It makes me sick that you’re a partial owner of the Bucks…

